The American Chemistry Matters blog is a resource that can help you better navigate and understand the U.S. chemical industry. Get up to date on the latest developments within the industry — including weekly economic updates, new technologies, processes & innovations, and our thoughts and positions on different policies and issues.
0.7%
Global CPRI
98.0
Consumer Confidence
6.3%
Durable Goods Orders
Running tab of macro indicators: 10 out of 20
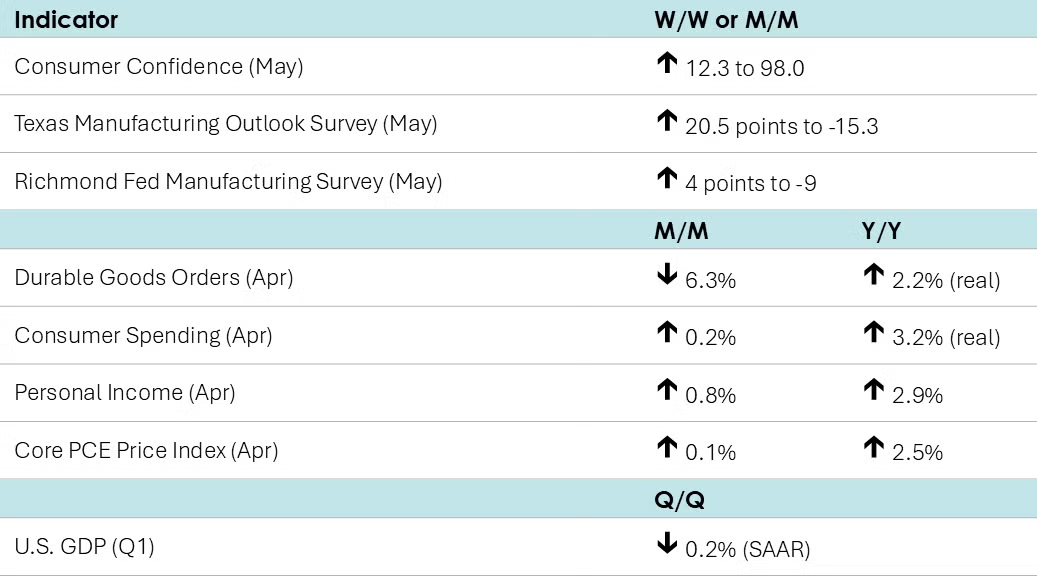
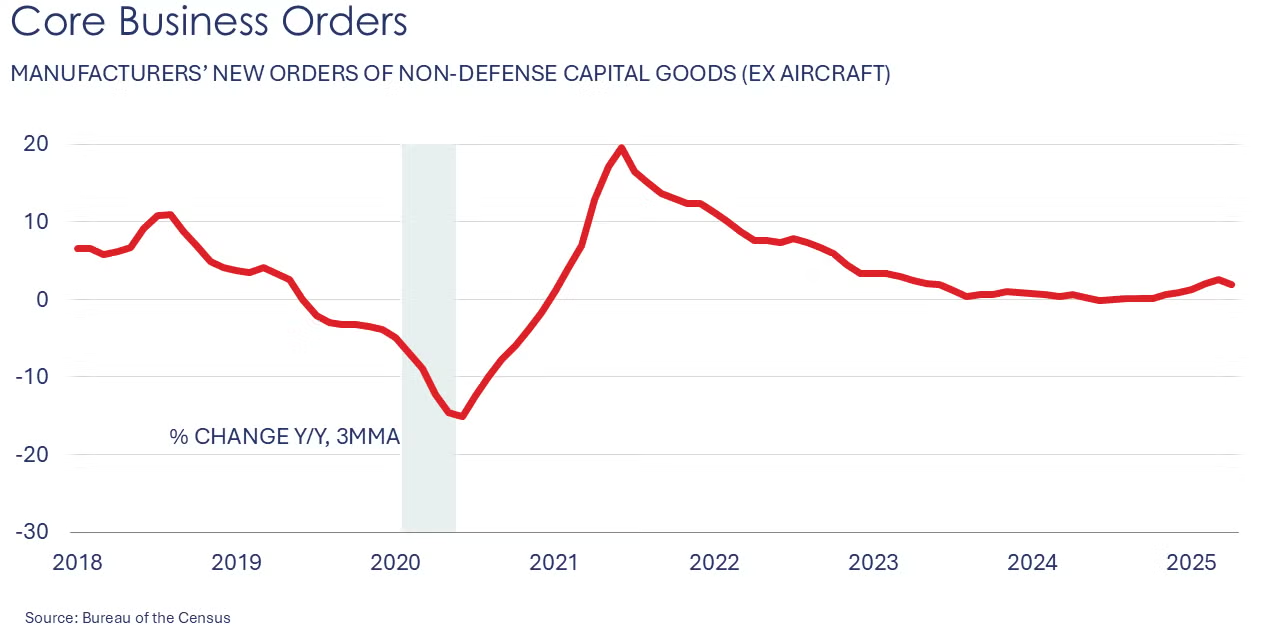
As expected, headline orders for long-lasting durable goods fell 6.3% in April following a 7.6% gain in March. The decline was led by a sharp pullback in civilian aircraft orders. There were also declines in orders for motor vehicles & parts, electrical equipment, communications equipment and primary metals. These declines were offset by higher orders for machinery, fabricated metal products, and computers. Core business orders (nondefense capital goods excluding aircraft) were 1.3% lower.
Following five months of consecutive declines, consumer confidence rebounded in May, up 12.3 points to 98.0. The Conference Board noted that around half the responses came in after the May 12th pause in tariffs between China and the U.S. and stock market recovery. Purchasing plans for homes and cars increased while plans to buy big-ticket items like appliances and electronics were also higher. Consumers noted, however, that they are more anxious about affordability than job security.
Coming off a strong 0.7% gain in March, consumer spending downshifted in April to a 0.2% gain. Spending on durable goods was lower, following a large gain in March when consumers bought big-ticket items ahead of tariffs. Spending on nondurable goods was flat, but spending on services was higher. Disposable (after-tax) personal income rose 0.8% in April. While employee compensation and self-employment income continued to rise, there was also a large increase in Social Security benefits due to implementation of the Social Security Fairness Act that eliminated reductions to benefits for certain public sector workers who also received pensions from state or local governments. As income rose faster than spending, the personal savings rate rose from 4.3% in March to 4.9% in April. Compared to last April, real (inflation-adjusted) personal income was up 2.9% Y/Y while real consumer spending was up 3.2% Y/Y.
The personal consumption expenditures (PCE) price index edged higher by 0.1% in April and was up 2.1% Y/Y. The Fed’s preferred measure of inflation, the core PCE price index (excluding the volatile food and energy components), was also up by 0.1% and ahead 2.5% Y/Y. This was the lowest annual growth in the closely-watched core PCE price index in four years. The moderation suggests that inflation has been largely unimpacted by tariffs thus far.
Pending home sales fell 6.3% in April with declines across all major regions. Based on contract-signings, pending home sales are a good leading indicator for existing home sales given the time it takes to go from contract to closing. Existing home sales are recorded at closing.
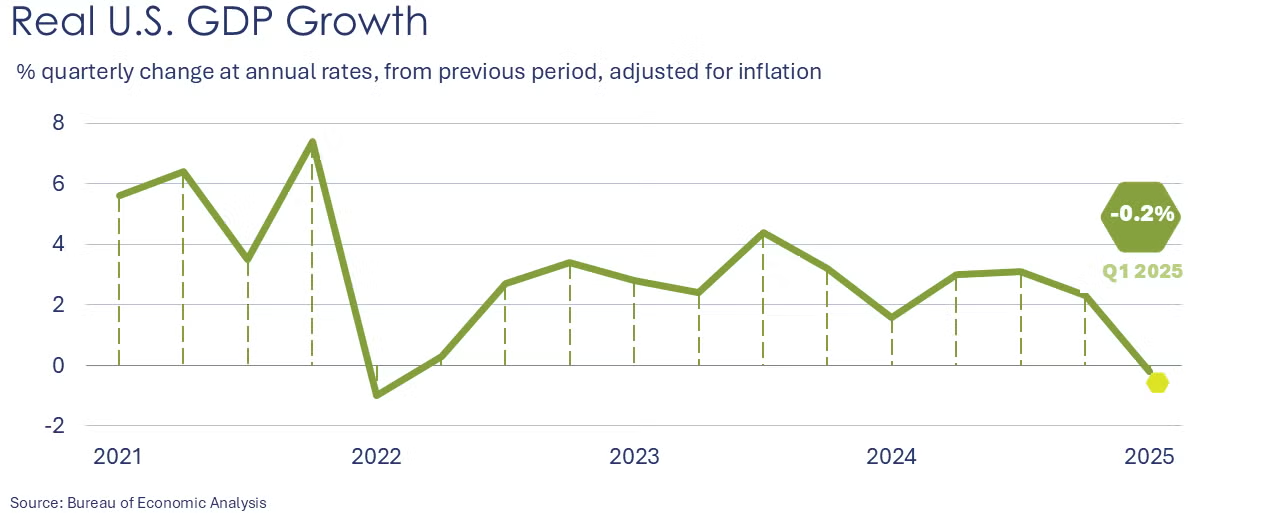
In its second of three estimates, the Bureau of Economic Analysis (BEA) upwardly revised its estimate of real (inflation-adjusted) Q1 GDP to a 0.2% contraction at a seasonally adjusted annual rate (SAAR), up from its first estimate of -0.3%. Inventory investment was revised higher (in part due to higher inventories of chemicals), but partially offset by a downward revision to consumer spending. Overall, the contraction in Q1 GDP reflected a large negative contribution from net trade as businesses and consumers ramped up imports ahead of tariffs. Imports count as a negative contribution in GDP accounting. Real final sales to domestic purchasers (the total amount of goods and services consumers, businesses, and the government in the U.S. actually bought) rose at a 2.5% SAAR (down from 3.0% in the first estimate). A third and final estimate will be published in late June.
Indicators for the business of chemistry suggest a yellow banner.
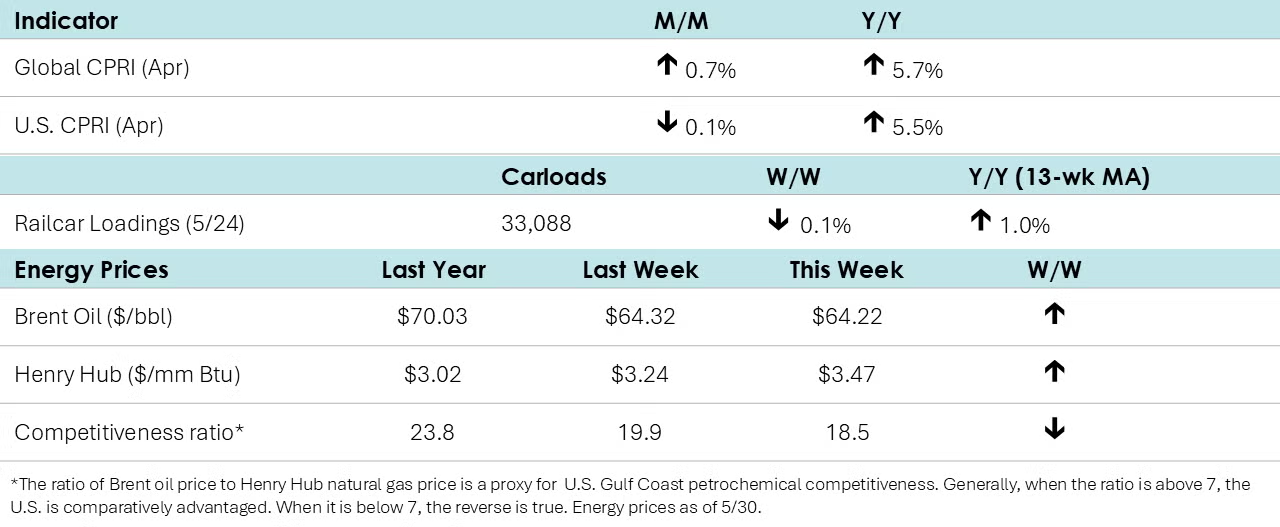
According to data released by the Association of American Railroads, chemical railcar loadings were down to 33,088 for the week ending May 24th. Loadings were up/down 1.0% Y/Y (13-week MA), up (2.0%) YTD/YTD and have been on the rise for seven of the last 13 weeks.
Within the details of the Texas Manufacturing Outlook Survey, comments from chemical industry respondents included:
- The basic materials market is being impacted by the tariff uncertainties and overall lower consumer confidence levels as we work through the policy changes impacting the markets. "Uncertainty" is the key word, and getting to a "new norm" so that business planning and forecasts can stabilize sooner than later is our hope as we look out six months. Fiscal policy decisions on future interest rate adjustments to boost internal U.S. growth are a key factor in the basic materials markets as it relates to the building/construction and automotive sectors.
- Decision-making remains extremely difficult due to extreme tariff uncertainty.
Within the details of the Q1 GDP report, BEA noted that the upward revision in inventory investment reflected “an upward revision to nondurable goods manufacturing (specifically, chemical manufacturing) that was largely offset by a downward revision to nondurable goods wholesale trade (drugs and sundries).”
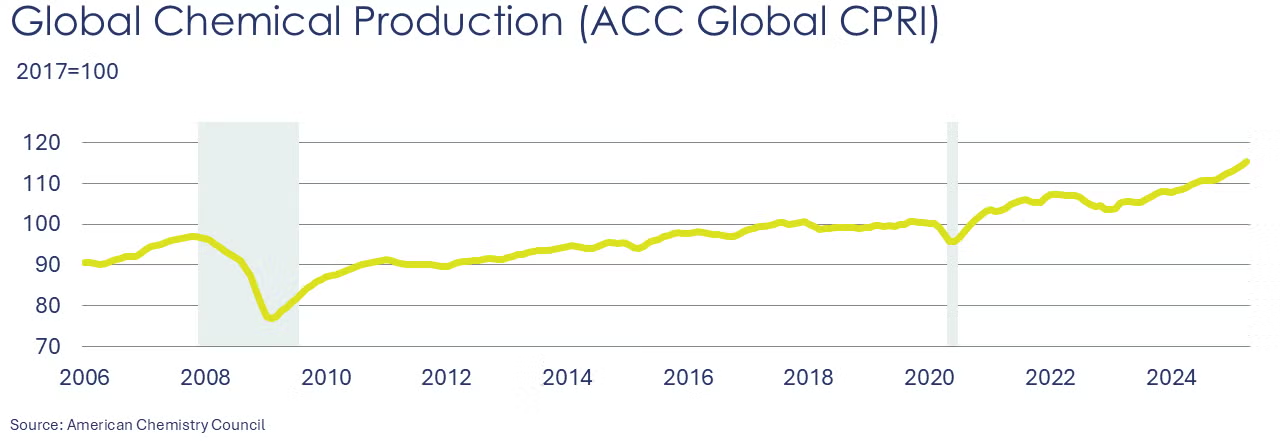
Following a 0.7% gain in March, ACC’s Global Chemical Production Regional Index (Global CPRI) increased by 0.7% in April. The Asia-Pacific region led the gain as trade actions prompted front loading of manufactured goods from the region. European production also benefited from front loading, but the momentum there slowed. In South America, production continued to edge down this month; however, year-over-year growth remained positive as economic conditions continued to improve in the region. All segments saw improvement, and year-over-year production rose by 5.7%.
For more details, check out our new CPRI Dashboard.
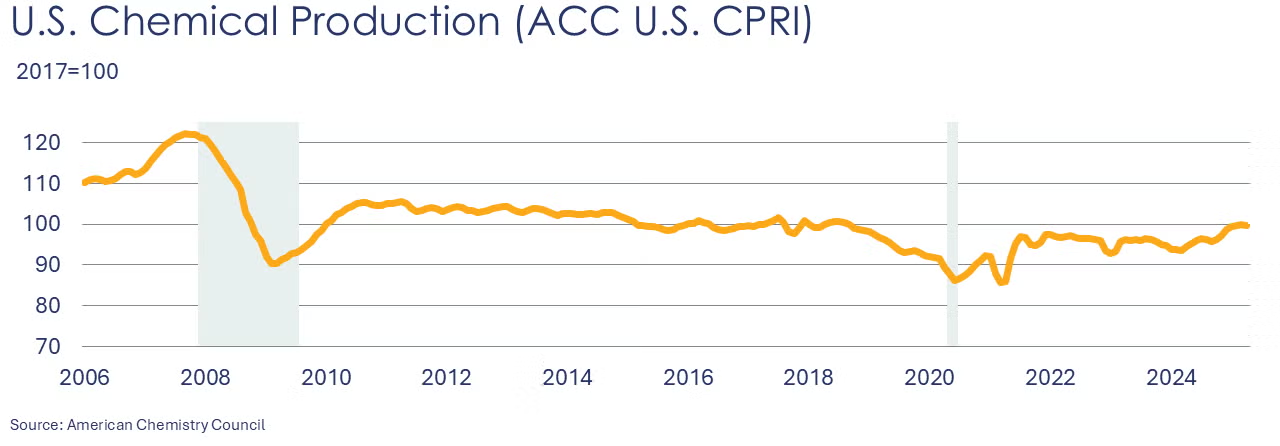
The U.S. CPRI edged down by 0.1% in April. This index measures chemical production trends based on a three-month moving average to smooth out month-to-month volatility. Production declined in most regions of the country except Gulf Coast. Overall, the U.S. CPRI is 5.5% higher than it was a year ago.
Energy Wrap-Up
- Oil prices trended higher as the U.S. banned Chevron from exporting Venezuelan oil and Canadian wildfires have forced the evacuation of staff in some areas in the northern part of the province.
- U.S. natural gas futures were higher than a week ago as the front-month contract rolled to July.
- Natural gas inventories rose by 101 BCF last week, still ahead of the five year average, but 11.3% lower than a year ago.
- The combined oil & gas rig count fell by 10 to 563 at the end of last week, the lowest since November 2021.
Note On the Color Codes
Banner colors reflect an assessment of the current conditions in the overall economy and the business chemistry of chemistry. For the overall economy we keep a running tab of 20 indicators. The banner color for the macroeconomic section is determined as follows:
Green – 13 or more positives
Yellow – between 8 and 12 positives
Red – 7 or fewer positives
There are fewer indicators available for the chemical industry. Our assessment on banner color largely relies upon how chemical industry production has changed over the most recent three months.
For More Information
ACC members can access additional data, economic analyses, presentations, outlooks, and weekly economic updates through ACCexchange.
In addition to this weekly report, ACC offers other economic data that cover topics such as worldwide production, trade, shipments, inventories, price indices, energy, employment, investment, R&D, and EH&S. To order, visit the ACC Store.
Every effort has been made in the preparation of this weekly report to provide the best available information and analysis. However, neither the American Chemistry Council, nor any of its employees, agents or other assigns makes any warranty, expressed or implied, or assumes any liability or responsibility for any use, or the results of such use, of any information or data disclosed in this material.
Contact ACC's Economics & Data Analytics department.